2010-2011 Room 7's year long project:
an amusement park to raise funds for Free The Children
.
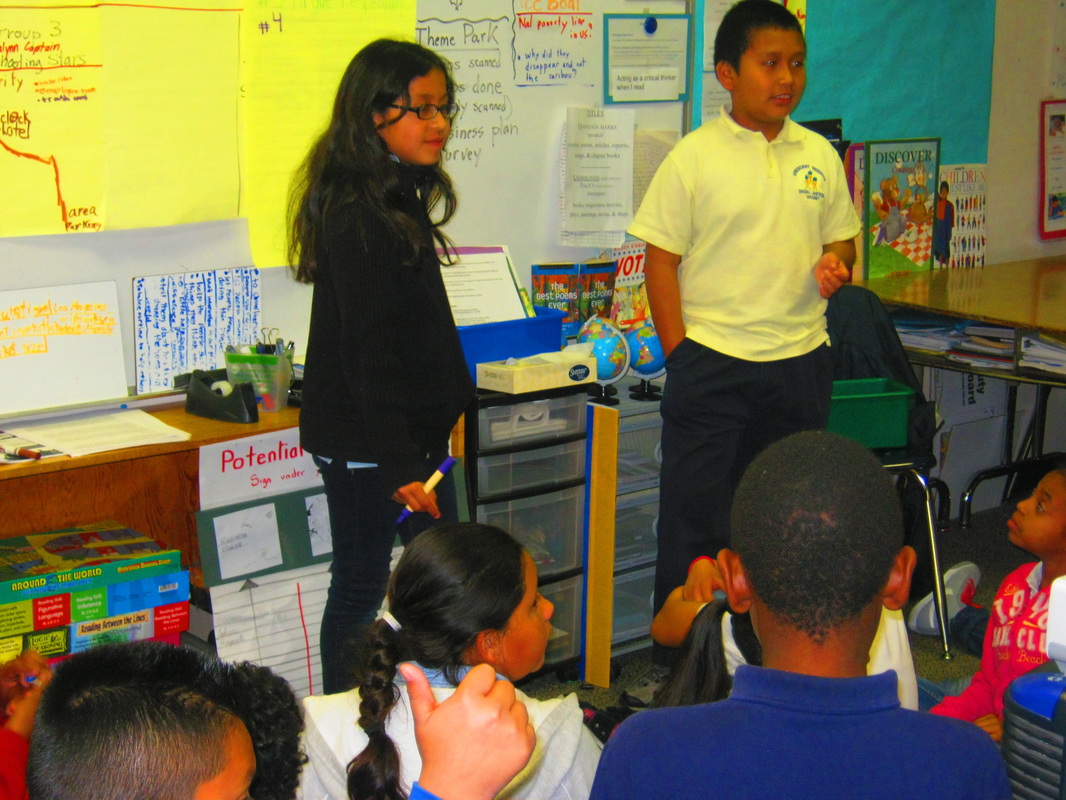
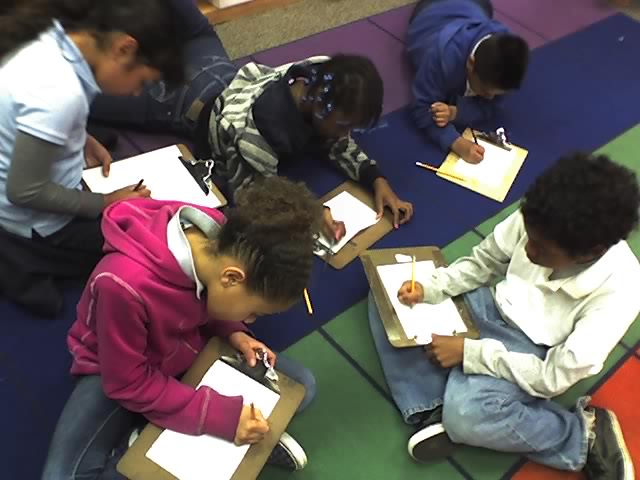
10/1/10: initial planning Part 1
After a week of research,
students get together to decide what should be on the park.
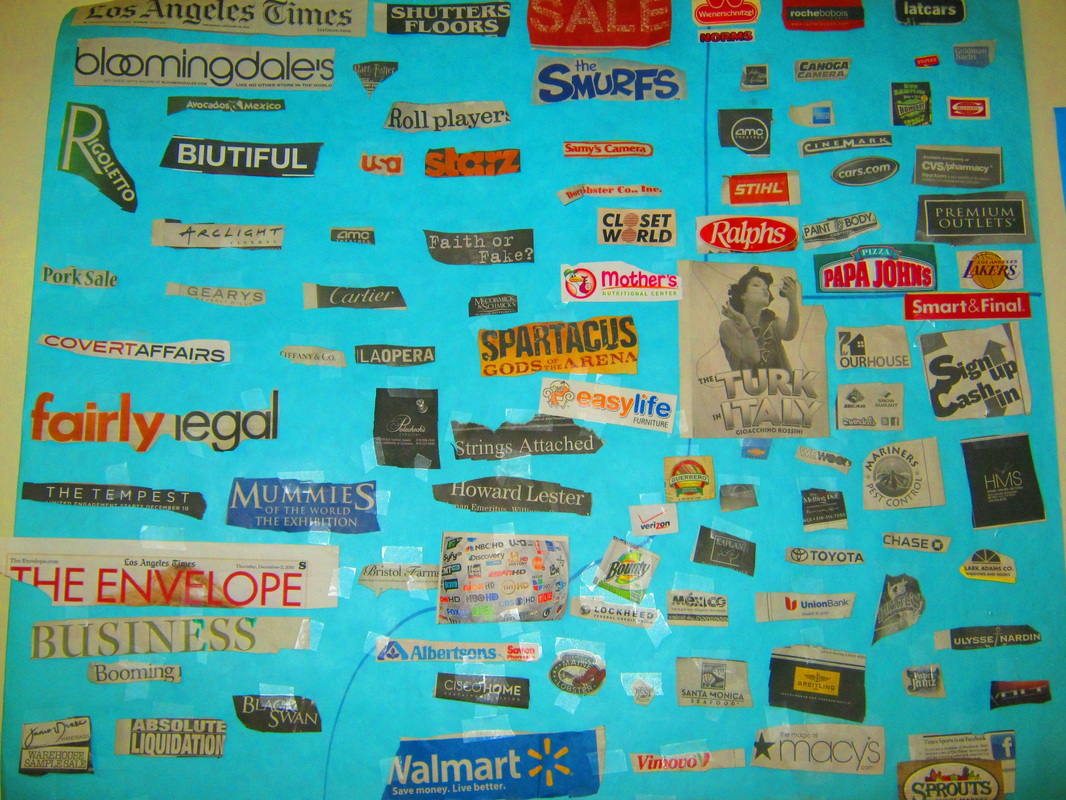
Market Research and Corporate Identity
First students voted for a name, then researched and studied some existing logos.
Afterwards, they created a few designs and voted for a final one.
Afterwards, they created a few designs and voted for a final one.

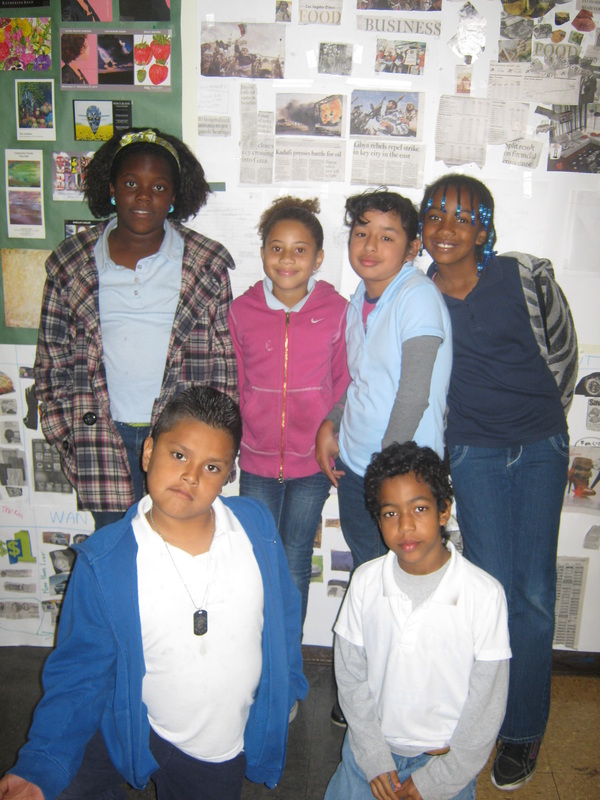
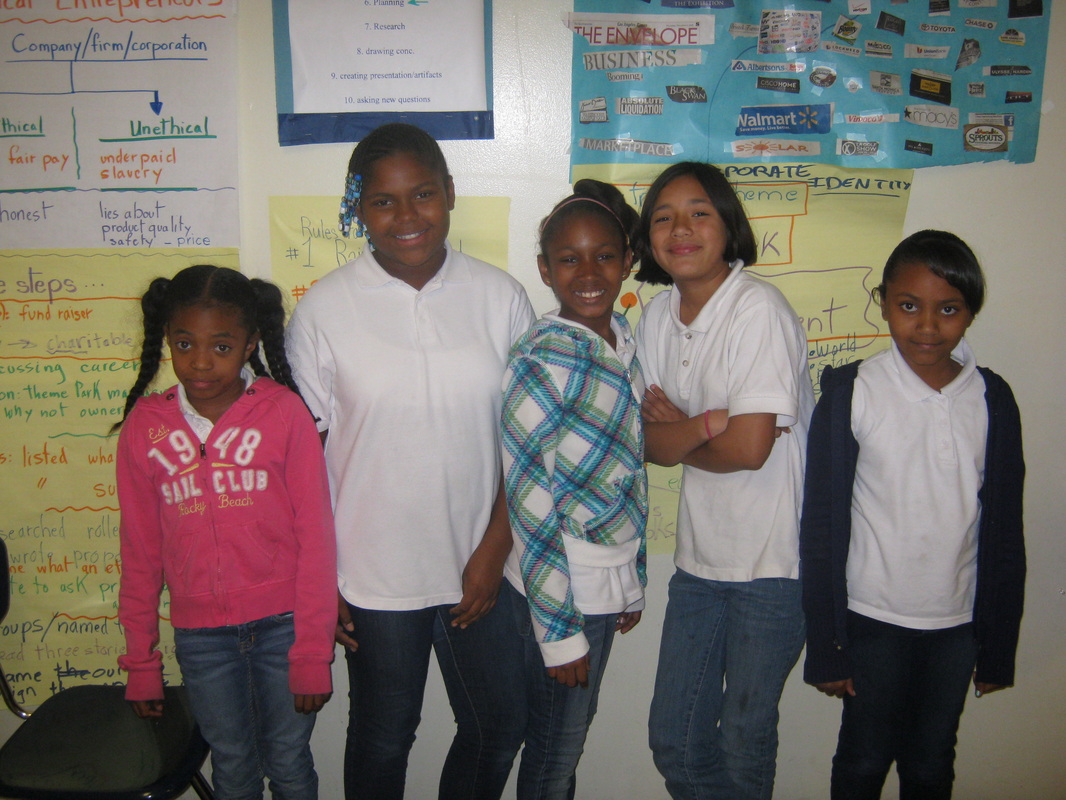
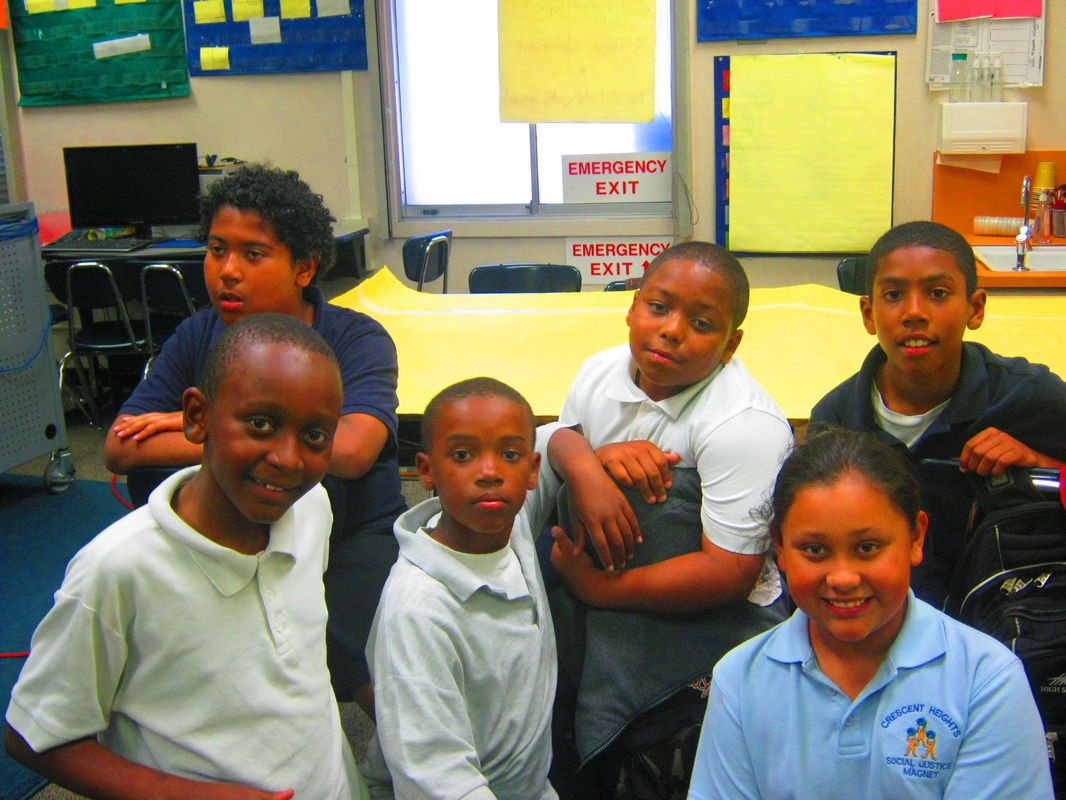
The Teams
Students organized and named their teams: The Wizards, Shooting Stars, Super Sonics, Red Knights, Seven Amigos


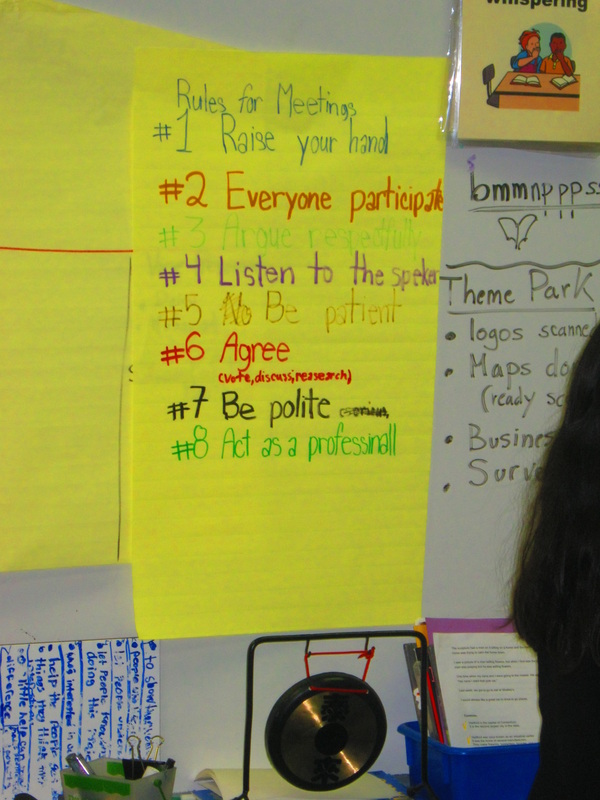
Ensuring Efficiency
The class voted for two vice presidents and established the rules.
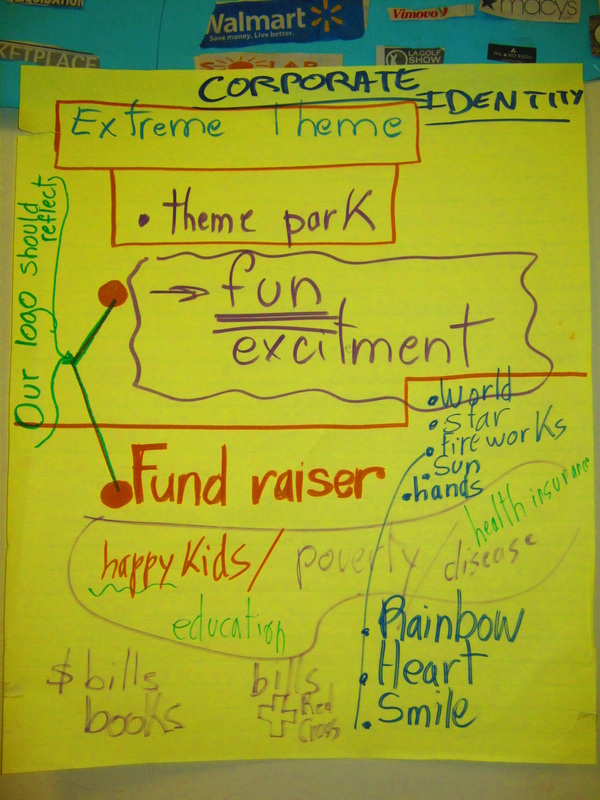
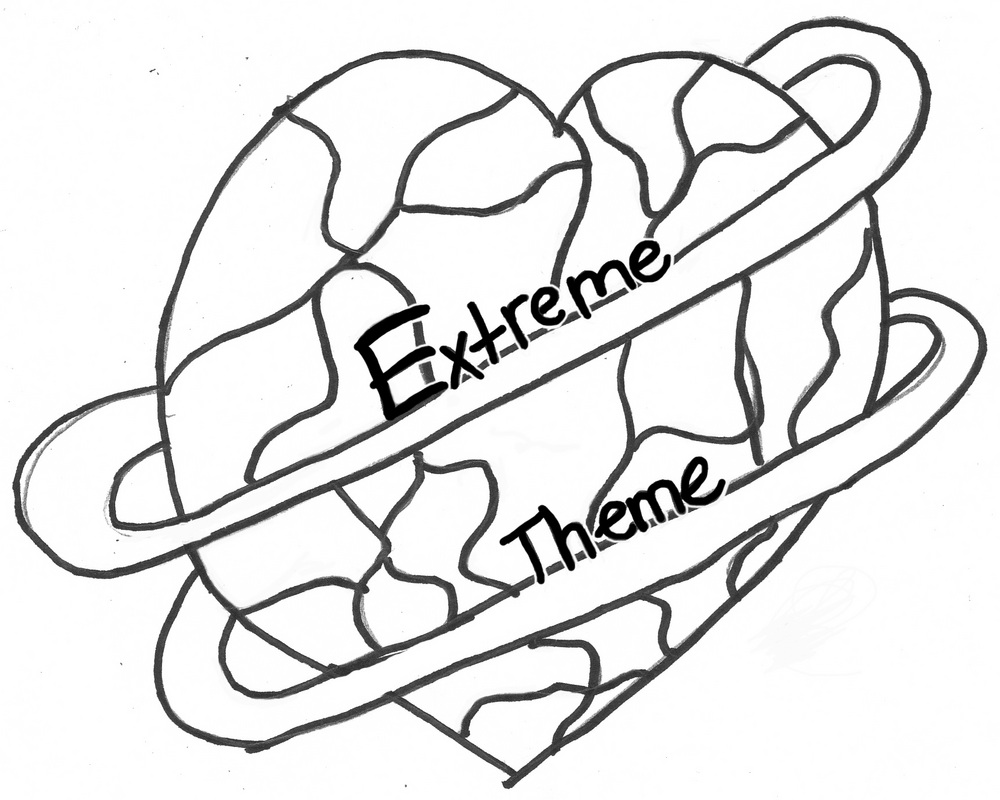
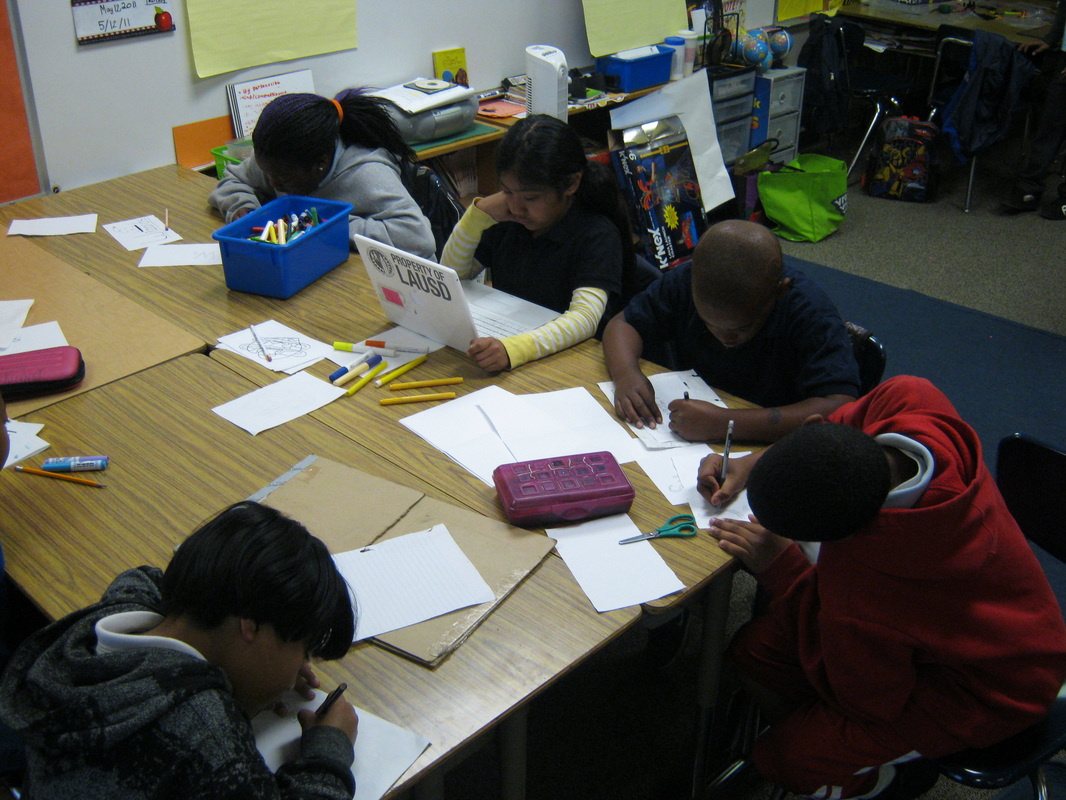
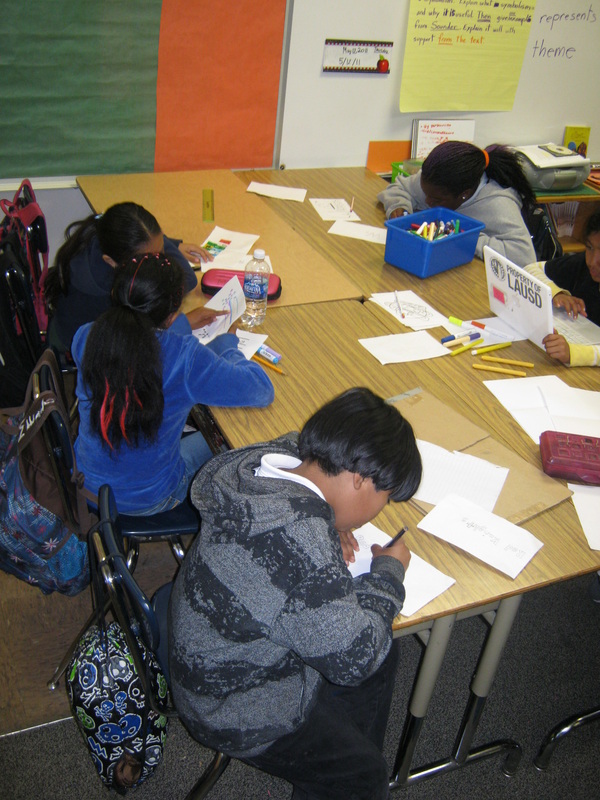
Designing the Team's Logo
After deciding what would be in each area, teams worked on their identity.


The final graphic designers
Ana Rosa of the Seven Amigos, Rodney of the Red Knights, Raquel of the Wizards,
Vernon of the Super Sonics, and Justice of the Shooting Stars
Vernon of the Super Sonics, and Justice of the Shooting Stars
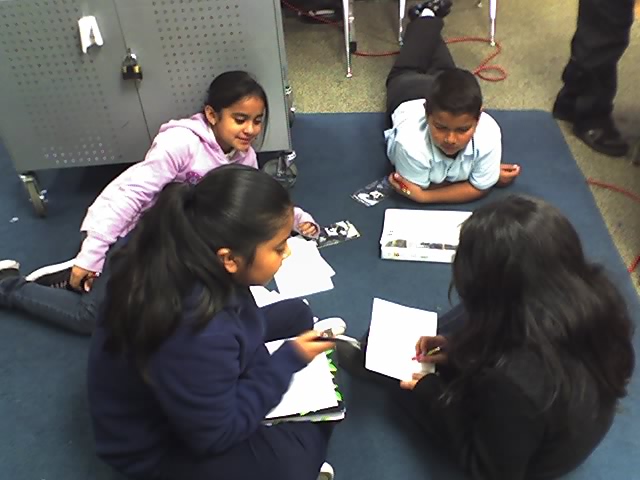
Market Research: Surveying the Target "Customers"
The community
Students conducted a survey at home to find out about their community.
Teams gathered their data onto one tally chart, then we gathered them all in a large tally chart.
Afterwards, using a kid friendly website, students in teams created bar charts to represent each age group.
Then, they analyzed and attempted to explain their findings.
Finally, each team created a line graph to study the changes over time.
They analyzed the results and asked three questions based on the graph.
Theme Park, Fund Raising Project - Surveys
Why?
We needed to find out how people (would) like to spend money.
The results would help us in creating
an effective advertising campaign for our theme park.
Almost all students in class 7 conducted an interview asking family or/and community members
how they would spend $40,000.
In teams, students regrouped their data onto one sheet (tally chart) (Skills: organization, collaboration)
They discussed their findings (Skill: critical thinking)
Then, the class gathered and reported all data onto one poster (tally chart)
(Skills: organization, collaboration, professional attitude/patience)
Students observed how to enter all data using a kid friendly graph program and build a bar graph and a pie chart.
(Studying skills)
After a quick analysis, we concluded that a more precise analysis was needed.
Each team focused on an age group and created a bar graph and a pie chart for that group.
They analyzed and wrote down their observations as well as possible explanations for the most and least favorite ways.
(Skill: technology/critical thinking/collaboration)
Afterwards, each team focused on a way to spend $40,000 (house, luxury, sharing, education, or investing)
and created a line graph showing the changes as the population ages.
Students were to ask three questions based on the new graph. (Skill: technology/critical thinking/collaboration)
Next steps:
1. Create an advertising for each group. (Skill: critical thinking/problem solving)
2. Re-do the whole procedure to survey our most direct target: students at our school.
This time, the class will have to formulate the right questions that would reveal useful information from which they could create an effective campaign.
3. Design and create a survey template.
Surveying
The School
Using Excel
Using Excel
Grid Making for our Planning
Skills: collaboration, geometry
